The Case for Making SNAP Benefits Adequate: Reflections from Interviews with Older Adults
This report sheds light on the importance of the Supplemental Nutrition Assistance Program (SNAP) for older adults and the positive impacts of the temporary increase in SNAP benefits during the COVID-19 pandemic. SNAP — the nation’s first defense against hunger — is vital to participants’ food security, nutrition, and health, and to the economy.
Interactive US Map: Food Insecurity Rates Among Older Adults
Explore rates of food insecurity and very low food security by state among older adults in our interactive map.
Interactive State Map: Households with older adults (60+) facing food insecurity
This interactive map, produced in collaboration with the AARP Foundation, shows the share of all households with older adults (age 60+) in each state that participate in SNAP at the state, metropolitan, small town, and rural levels.
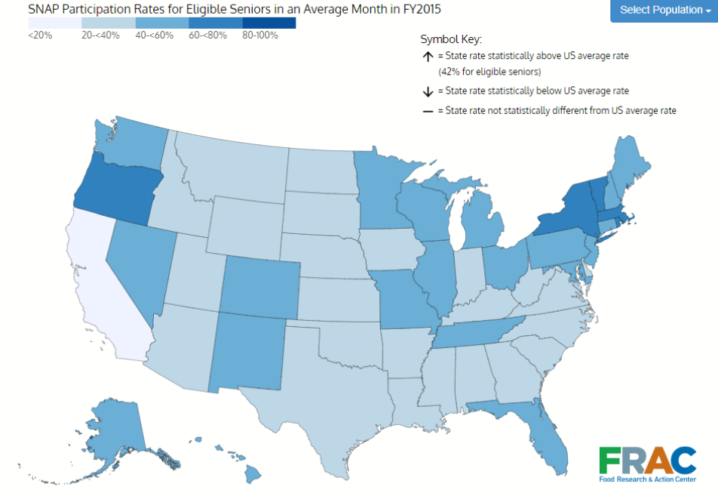
Interactive State Map: Share of Older Adult (60+) Households Participating in SNAP
This interactive map, produced in collaboration with the AARP Foundation, shows the share of all households with older adults (age 60+) in each state that participate in the Supplemental Nutrition Assistance Program (SNAP) at the state, metropolitan, small town, and rural levels.
Interactive County Map: SNAP Matters to Older Adults in Every Community- Metro, Small Town, and Rural Areas
This interactive map, produced in collaboration with the AARP Foundation, shows the share of all households with older adults (age 60+) in each state that participate in SNAP at the state, metropolitan, small town, and rural levels.
Federal Nutrition Programs referral chart
Explore this chart to learn more about different federal nutrition programs available to older adults.
Did You Know?
Too many of our nation’s older adults struggle against hunger and poverty. In 2020, 5 million people aged 65 and over lived in poverty in the United States. Nearly 3 million food-insecure households included an adult age 65 or older in the same year. SNAP can help.
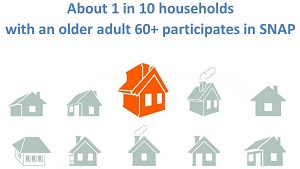
One in 10 of the nation’s 47.6 million households with adults (age 60+) participated in the Supplemental Nutrition Assistance Program (SNAP), on average each year between 2015–2019.
Check out FRAC’s Resource Library for additional materials on older adults and more.
Quick Facts
- In 2020, 9% – 5 million – of people age 65 and over in the United States lived in poverty. 1
- In 2020, more than 2.8 million food-insecure households included an adult age 65 or older. This represents 7.2% of all households with an older adult (65+). 2
- 1.28 million adults age 65 or older (8.3%) who lived alone were food insecure in 2020, and approximately 531,000 of these older adults were experiencing very low food insecurity. 3
- Older adults were hit particularly hard by the economic and public health crisis caused by the COVID-19 pandemic. Millions of older adults struggled to put food on the table, with some age, racial, ethnic groups disproportionately impacted by increased rates of food insecurity. 4
- SNAP benefited approximately 5.3 million households with at least one older adult (60+) in FY 2019. 5 Even so, millions of eligible older adults miss out on SNAP. 6
- In fiscal year 2019, the average SNAP benefit for households with an older adult was $120. 7
- SNAP played a vital role during the COVID-19 pandemic. Participation grew to meet additional need. In response to acute levels of food hardship, the federal government increased SNAP benefit amounts temporarily. 8
Sources:
1 Shrider, E., Kollar, M., Chen, F., Semega, J. (2021) Income and Poverty in the United States: 2020. Current Population Reports. U.S. Census Bureau
2 Coleman-Jensen, A., Rabbitt, M. P., Gregory, C. A., & Singh, A. (2021). Household Food Security in the United States in 2020. Economic Research Report, 298. U.S. Department of Agriculture, Economic Research Service.
3 Ibid.
4 Dean, O. (2021). Pandemic Widens Food Insecurity Disparities Among Older Adults.
5 Cronquist, K. (2021). Characteristics of Supplemental Nutrition Assistance Program Households: Fiscal Year 2019. U.S. Department of Agriculture, Food and Nutrition Service.
6 Lauffer, S., Vigil, A. (2021). Trends in Supplemental Nutrition Assistance Program Participation Rates: Fiscal Year 2016 to Fiscal Year 2018. U.S. Department of Agriculture, Food and Nutrition Service.
7 Cronquist, K. Characteristics
8 Ashbrook, A., Beaudoin, S., Gomez, V., (2022). The Case for Making SNAP Benefit Adequate: Reflections from Interviews with Older Adults.
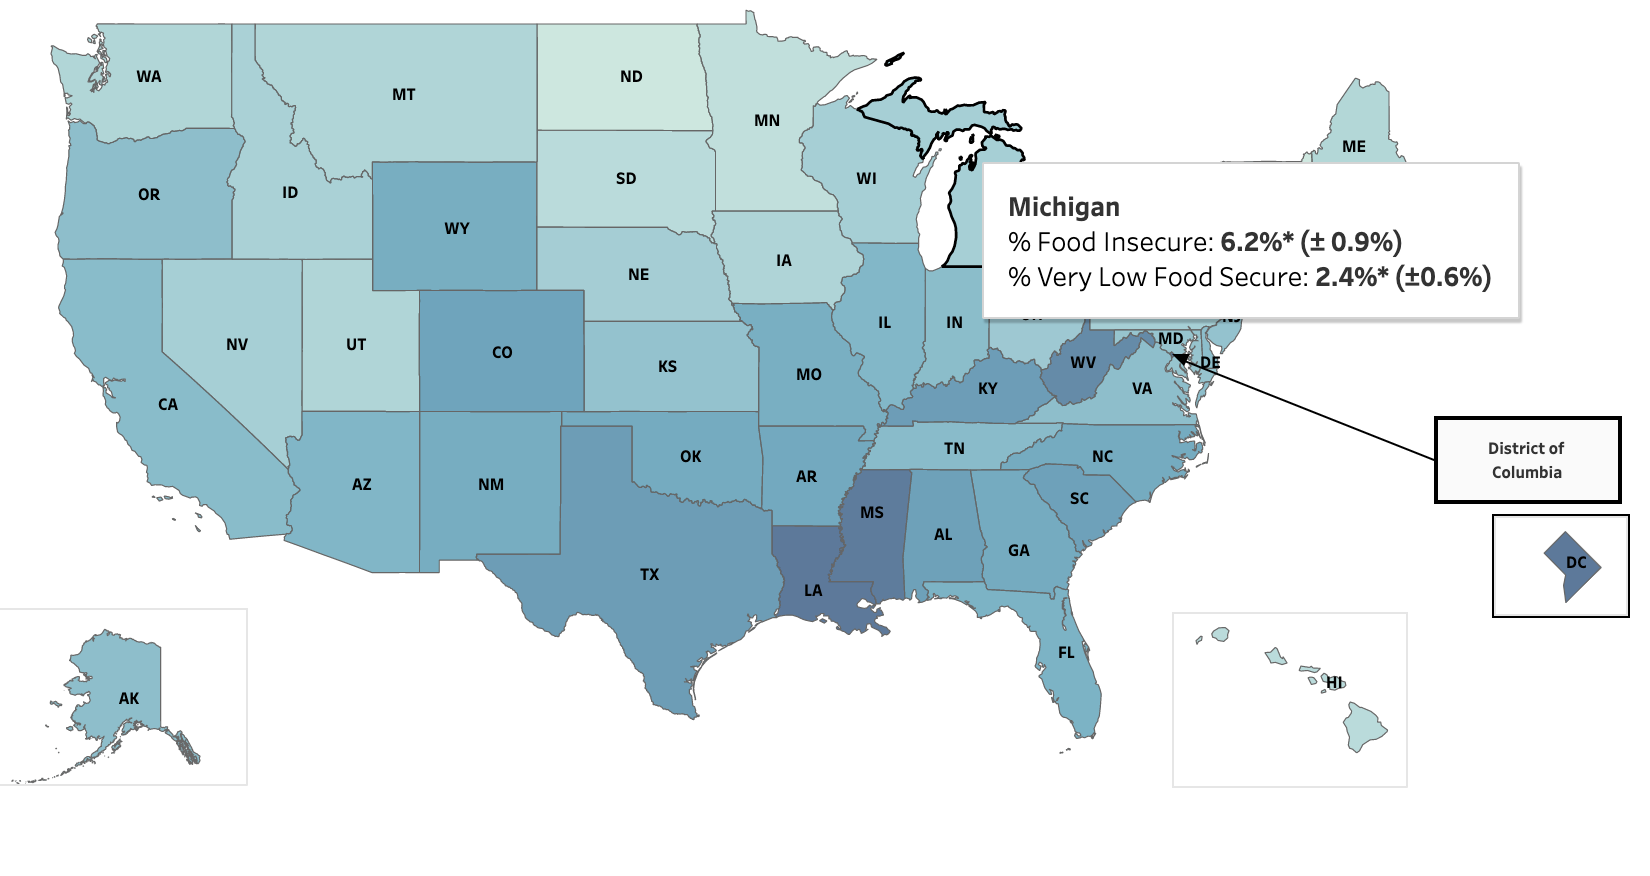
Interactive Map: Food Insecurity Among Older Adults
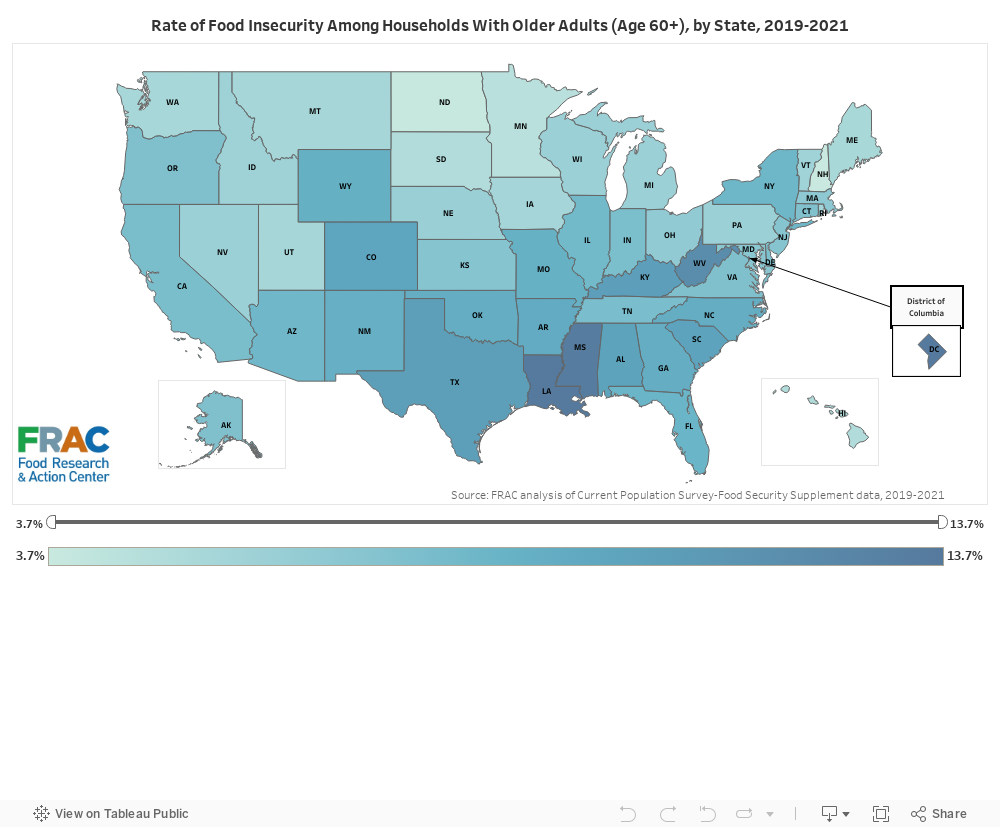
Rate of Food Insecurity Among Households With Older Adults (Age 60+), by State, 2019-2021
| State | Food Insecurity Rate | Food Insecurity Margin of Error (±) | Food Insecurity (FI) Statistically different from the national FI average of 8.1% for older adults (60+) | Very Low Food Security Rate | Very Low Food Security Margin of Error | Very Low Food Security (VLFS) Statistically different from the national VLFS average of 3.2% for older adults 60+ |
|---|---|---|---|---|---|---|
| Alaska | 7.6% | 1.8% | 3.8% | 1.2% | ||
| Alabama | 10.2% | 0.9% | * | 3.7% | 0.5% | |
| Arkansas | 9.5% | 1.2% | 4.2% | 0.7% | * | |
| Arizona | 8.4% | 1.2% | 3.1% | 0.8% | ||
| California | 7.9% | 0.5% | 2.8% | 0.3% | ||
| Colorado | 9.9% | 1.8% | 4.2% | 1.0% | ||
| Connecticut | 7.6% | 1.3% | 4.2% | 1.0% | ||
| District of Columbia | 12.8% | 1.3% | * | 3.7% | 0.6% | |
| Delaware | 7.7% | 1.3% | 2.4% | 0.7% | ||
| Florida | 8.6% | 0.7% | 3.6% | 0.5% | ||
| Georgia | 9.3% | 1.3% | 3.9% | 0.9% | ||
| Hawaii | 4.9% | 0.8% | * | 1.5% | 0.4% | * |
| Iowa | 5.6% | 1.3% | * | 2.0% | 0.6% | * |
| Idaho | 5.9% | 0.8% | * | 2.6% | 0.5% | * |
| Illinois | 8.3% | 0.8% | 3.5% | 0.6% | ||
| Indiana | 7.8% | 1.1% | 3.6% | 0.7% | ||
| Kansas | 7.3% | 1.1% | 2.5% | 0.6% | ||
| Kentucky | 10.5% | 1.4% | * | 4.2% | 1.0% | |
| Louisiana | 13.7% | 1.1% | * | 5.7% | 0.8% | * |
| Massachusetts | 6.9% | 0.8% | * | 2.8% | 0.6% | |
| Maryland | 7.1% | 1.0% | 2.9% | 0.9% | ||
| Maine | 5.4% | 0.7% | * | 2.5% | 0.4% | * |
| Michigan | 6.2% | 0.9% | * | 2.4% | 0.6% | * |
| Minnesota | 4.5% | 1.0% | * | 1.9% | 0.7% | * |
| Missouri | 9.0% | 1.1% | 4.0% | 0.9% | ||
| Mississippi | 13.5% | 1.7% | * | 4.7% | 0.6% | * |
| Montana | 5.5% | 0.7% | * | 2.2% | 0.5% | * |
| North Carolina | 9.3% | 1.2% | 3.6% | 0.7% | ||
| North Dakota | 3.9% | 0.7% | * | 1.2% | 0.4% | * |
| Nebraska | 6.2% | 1.0% | * | 3.5% | 0.7% | |
| New Hampshire | 3.7% | 0.7% | * | 1.0% | 0.4% | * |
| New Jersey | 7.3% | 0.8% | 2.4% | 0.5% | * | |
| New Mexico | 9.1% | 1.0% | 3.7% | 0.9% | ||
| Nevada | 6.1% | 0.9% | * | 2.6% | 0.6% | |
| New York | 8.5% | 0.8% | 3.0% | 0.4% | ||
| Ohio | 6.7% | 0.9% | * | 2.2% | 0.4% | * |
| Oklahoma | 9.3% | 1.1% | 3.7% | 0.6% | ||
| Oregon | 7.6% | 1.5% | 3.0% | 0.7% | ||
| Pennsylvania | 6.2% | 0.7% | * | 2.4% | 0.5% | * |
| Rhode Island | 5.7% | 1.0% | * | 1.6% | 0.5% | * |
| South Carolina | 10.1% | 1.4% | * | 5.3% | 0.8% | * |
| South Dakota | 4.9% | 0.7% | * | 0.9% | 0.4% | * |
| Tennessee | 7.9% | 0.9% | 3.5% | 0.6% | ||
| Texas | 10.5% | 0.9% | * | 3.9% | 0.5% | * |
| Utah | 5.5% | 0.8% | * | 2.2% | 0.6% | * |
| Virginia | 7.6% | 1.1% | 3.1% | 0.7% | ||
| Vermont | 5.8% | 0.6% | * | 1.5% | 0.3% | * |
| Washington | 5.4% | 0.9% | * | 1.9% | 0.4% | * |
| Wisconsin | 6.1% | 1.2% | * | 2.4% | 0.7% | |
| West Virginia | 12.1% | 2.1% | * | 4.3% | 0.5% | * |
| Wyoming | 9.0% | 0.9% | 4.0% | 0.8% |
SNAP is the first line of defense against senior hunger.
- Why SNAP Matters for Older AdultsThe Supplemental Nutrition Assistance Program (SNAP):
- is available to every eligible older adult, in every corner of the country.
- provides older adults with significant food purchasing power every month of the year.
- improves food insecurity and health, helping older adults to maintain their independence.
- reaches by far and away more older adults than any of the federal nutrition programs available to older adults.
In addition to SNAP, seniors could be eligible for additional federal programs depending on their income, health status, age, and whether the program is available in their area.
- Closing the senior SNAP GapOnly an estimated 48 percent of eligible adults age 60+ participate in SNAP. This compares to 83 percent of adults ages 18-59 in FY 2018. Why?
Source: Lauffer, S., Vigil, A. (2021). Trends in Supplemental Nutrition Assistance Program Participation Rates: Fiscal Year 2016 to Fiscal Year 2018. U.S. Department of Agriculture, Food and Nutrition Service.
- Risk Factors for Food Insecurity Among Older AdultsCertain older adults are at higher risk for food insecurity than others. Research shows that food insecurity rates tend to be higher among older adults who are:
- Low income
- Black
- Asian American, Pacific Islander, Native American, and multiracial
- Latinx
- Separated or divorced, or never married
- Renters
- Grandchild present
- Unemployed
- Living with a disability
- Living with chronic diseases
- Living with functional limitations
Sources: Ziliak, J. P., & Gundersen, C. (2021). The State of Senior Hunger in America 2019. Prepared for Feeding America.
Jih, J., Stijacic-Cenzer, I., Seligman, H. K., Boscardin, W. J., Nguyen, T. T., & Ritchie, C. S. (2018). Chronic disease burden predicts food insecurity among older adults. Public Health Nutrition, 21(9), 1737–1742.
Jackson, J. A., Branscum, A., Tang, A., & Smit, E. (2019). Food insecurity and physical functioning limitations among older U.S. adults. Preventive Medicine Reports, 14, 100829.
Heflin, C. M., Altman, C. E., & Rodriguez, L. L. (2019). Food insecurity and disability in the United States. Disability and Health Journal, 12(2), 220–226. - Older Adults Living with ChildrenOlder adults may reside in a household with children under 18 years of age (e.g., their own children, grandchildren), which can increase the likelihood of experiencing food insecurity. Parents and caregivers often try to protect children from food insecurity by, for example, sacrificing their own food and nutrition needs so that the children can eat.
National data show that, rates of food insecurity for an older adult residing with a grandchild are more than twice the rate for older adults not residing with a grandchild.
Sources:
Ziliak, J. P., & Gundersen, C. (2021). The State of Senior Hunger in America 2019. Prepared for Feeding America. - Other Federal Nutrition Programs for SeniorsIn addition to SNAP, seniors could be eligible for additional federal programs depending on their income, health status, age, and whether the program is available in their area.
Trending

Hunger is a Health Issue for Older Adults: Food Security, Health, and the Federal Nutrition Programs
Find out more
A Primer: SNAP Supports Older Adults Struggling Against Hunger
Find out more
Combating Food Insecurity: Tools for Helping Older Adults Access SNAP
A toolkit from FRAC and the AARP Foundation.
SNAP/Food Stamps: Doctor recommended to put healthy food on your plate
Download the poster
You don’t need to choose between food and medicine
Download the poster